Nvidia Stock Analysis
R, ggplot2, dplyr, tidyverse, readr, HTML, CSS, GitHub Pages
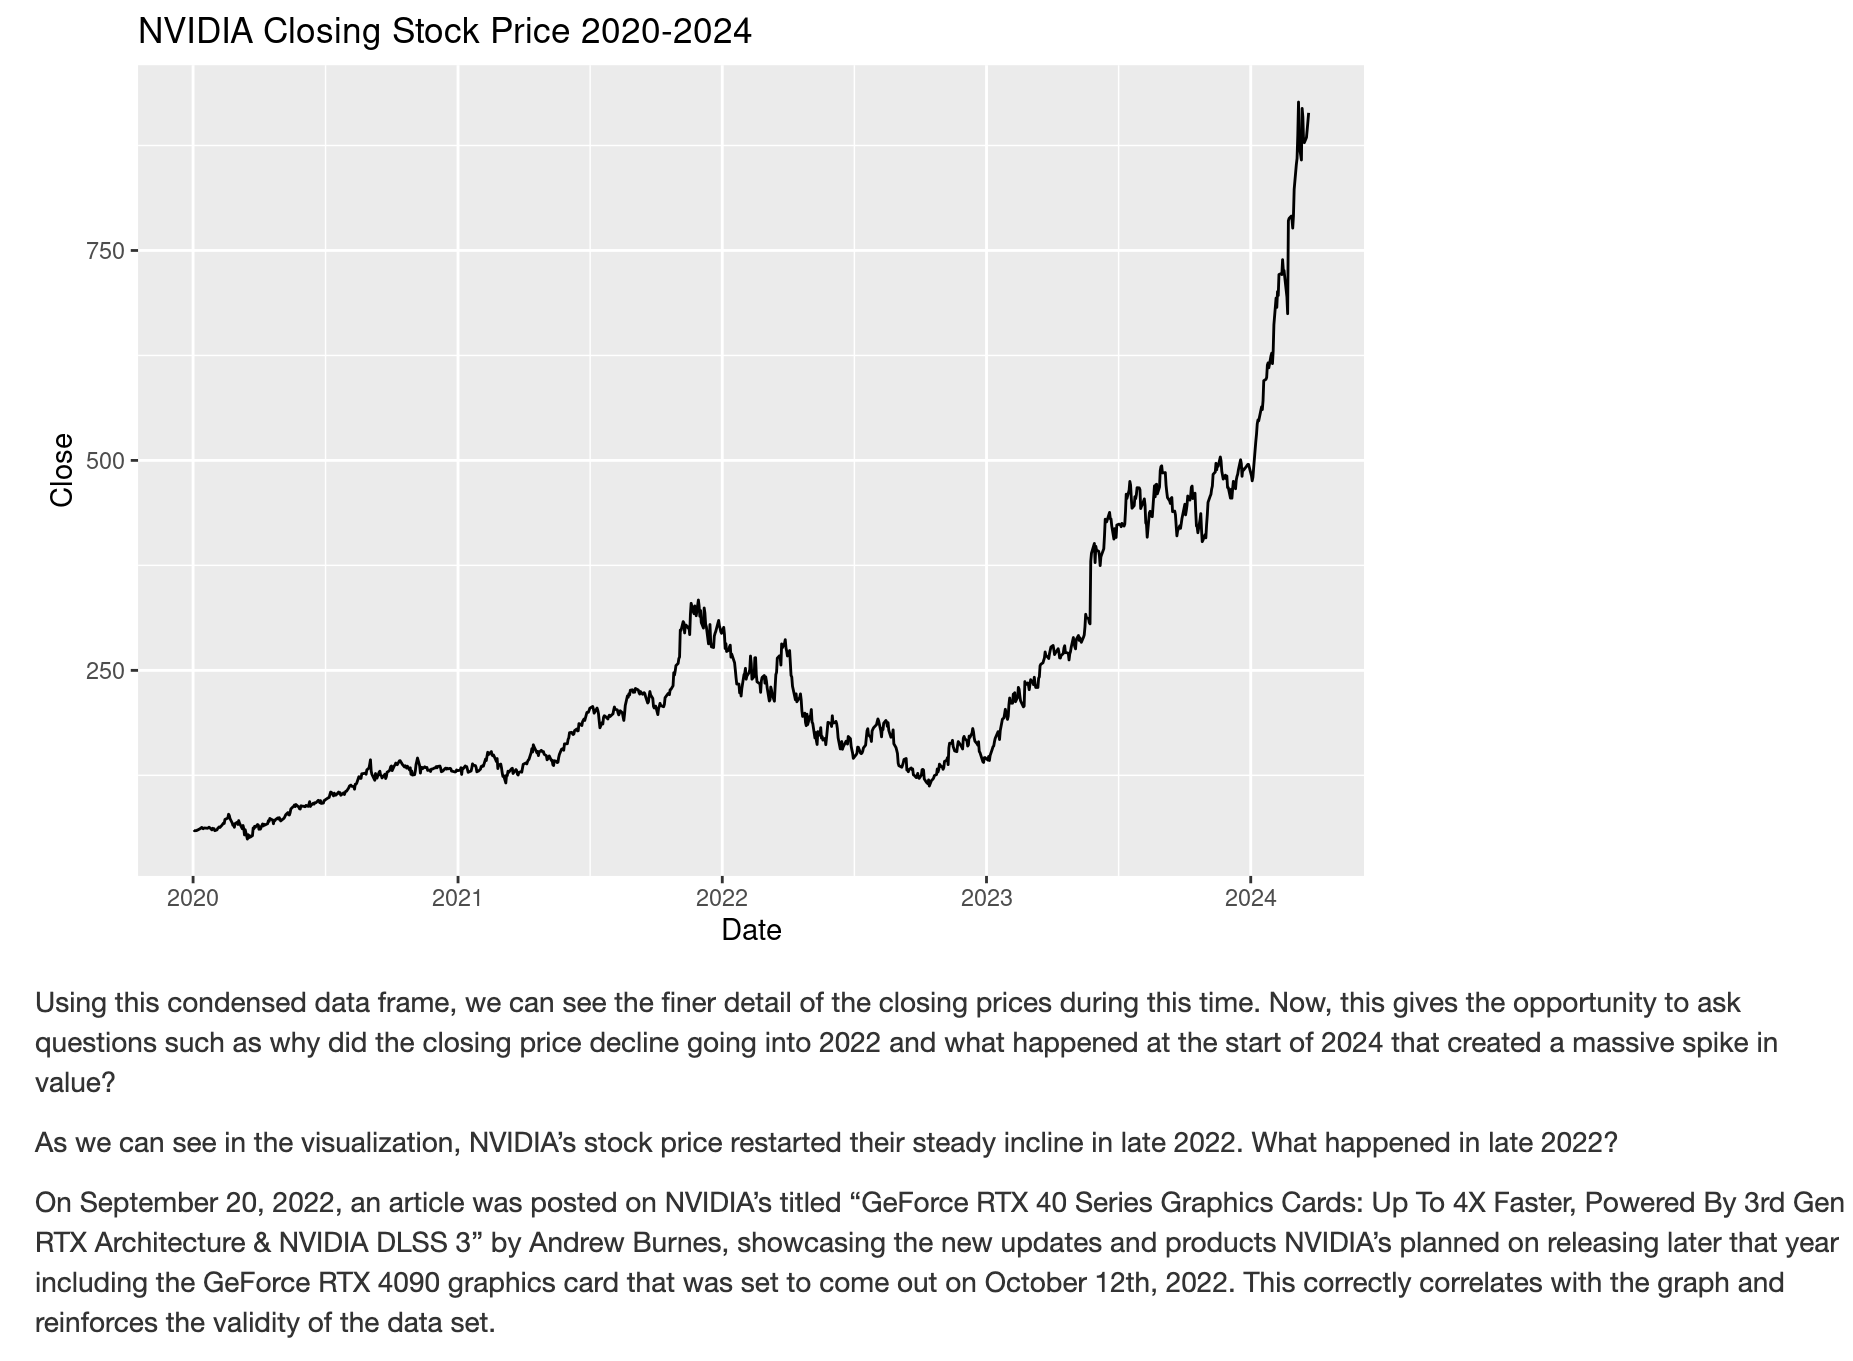
I analyzed NVIDIA’s stock performance from 1999 to 2024 to understand historical trends, volatility, and key price movements. Using R, I created visualizations and statistical summaries to gain insights into the company’s market behavior.
Live Report
GitHub Repo
Inspiration
I wanted to see how NVIDIA evolved from a GPU company to an AI powerhouse and how this growth impacted its stock price over 25 years. I also aimed to identify periods of high volatility and major market events.
What it does
The NVIDIA Stock Analysis project examines historical stock data to uncover patterns and trends over time. Key features include:
- Summary Statistics: Provides descriptive statistics, variance, and price ranges for closing prices.
- Stock Price Visualizations: Line charts showing opening, closing, high, and low prices from 1999–2024.
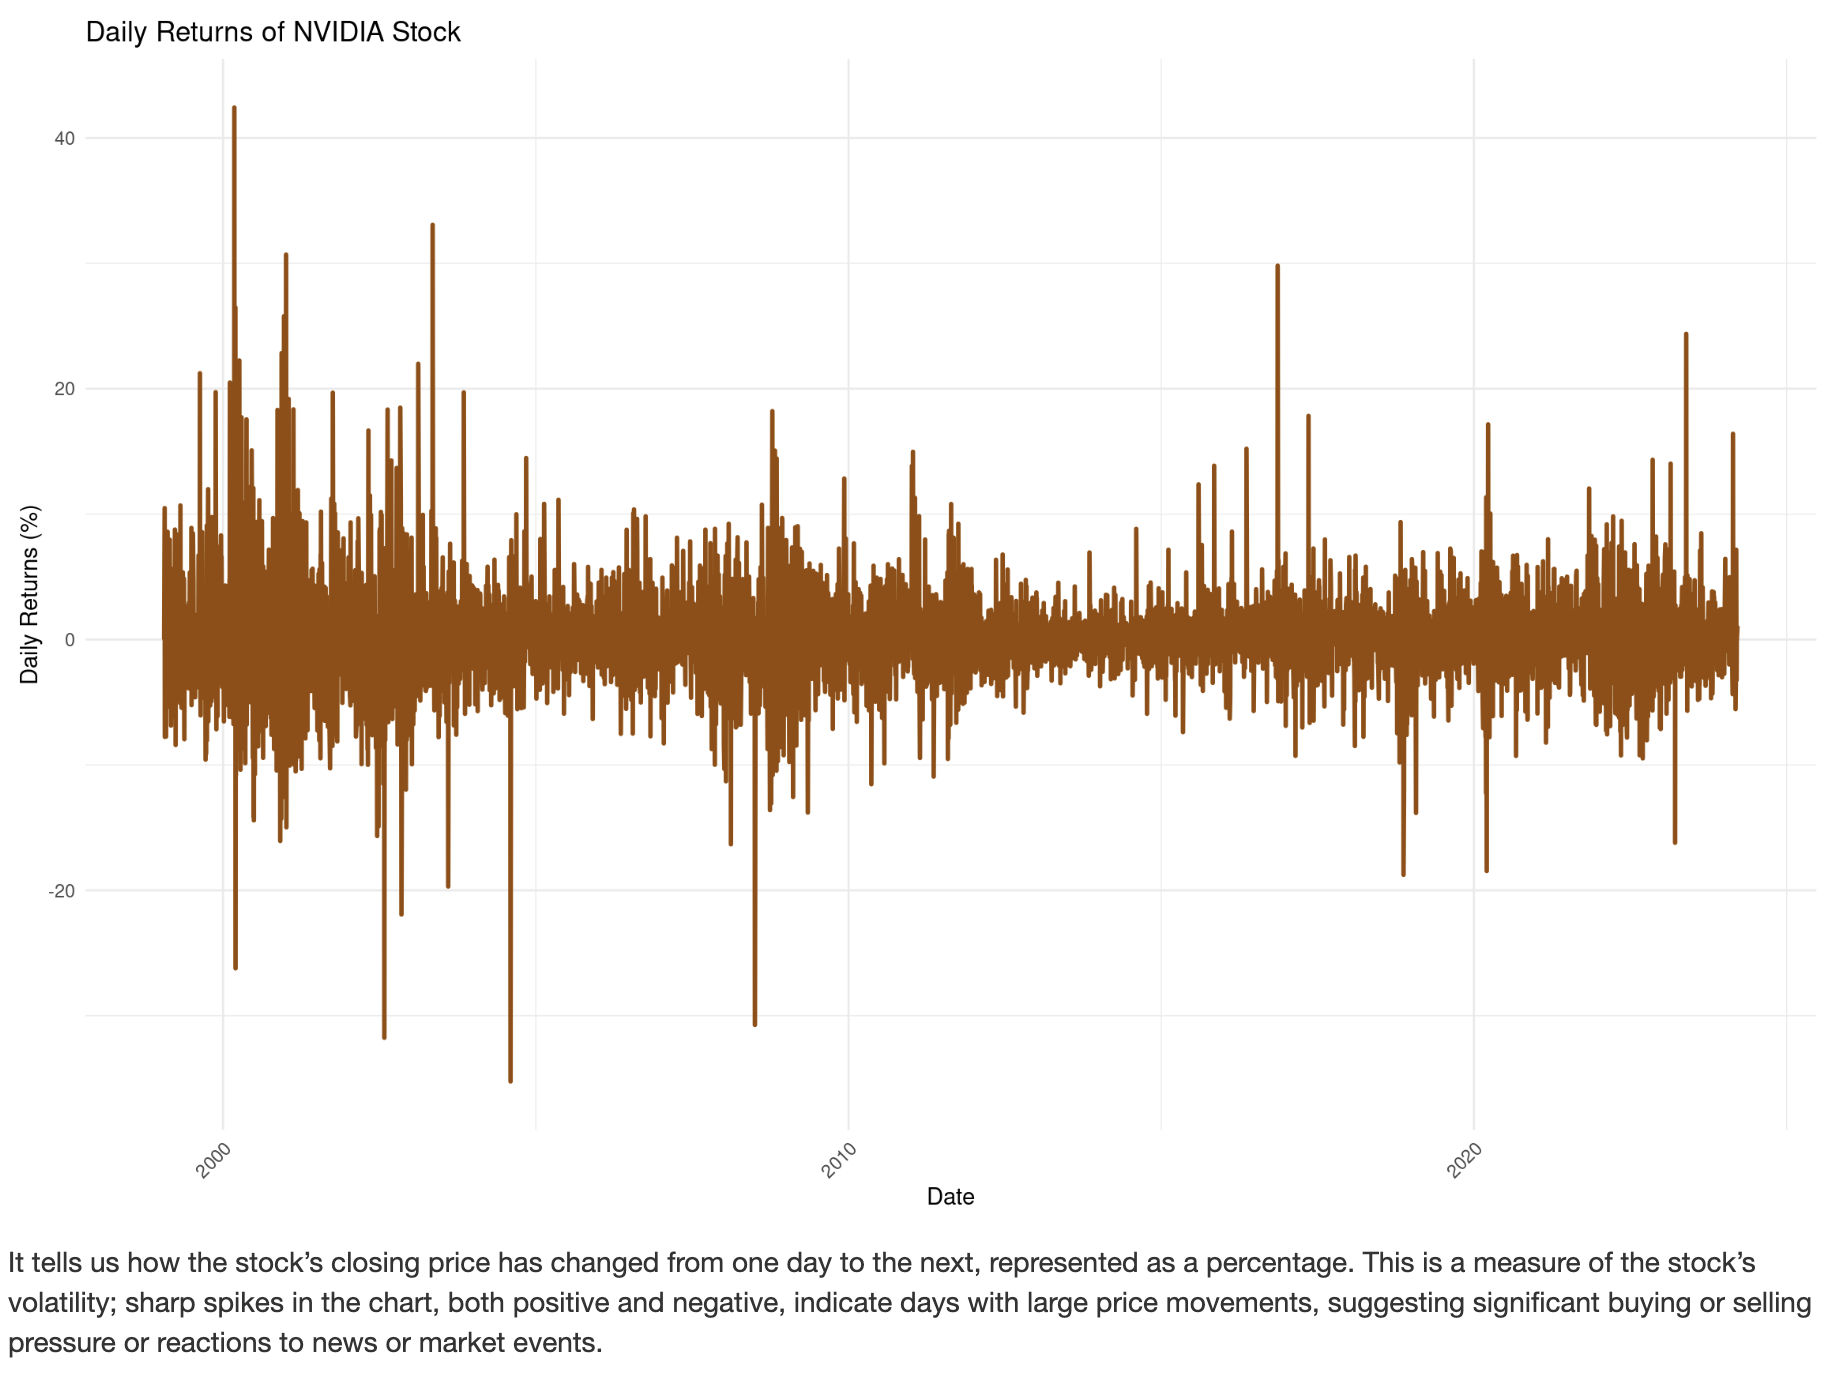
- Daily Returns Analysis: Tracks daily percentage changes to detect volatility and market spikes.
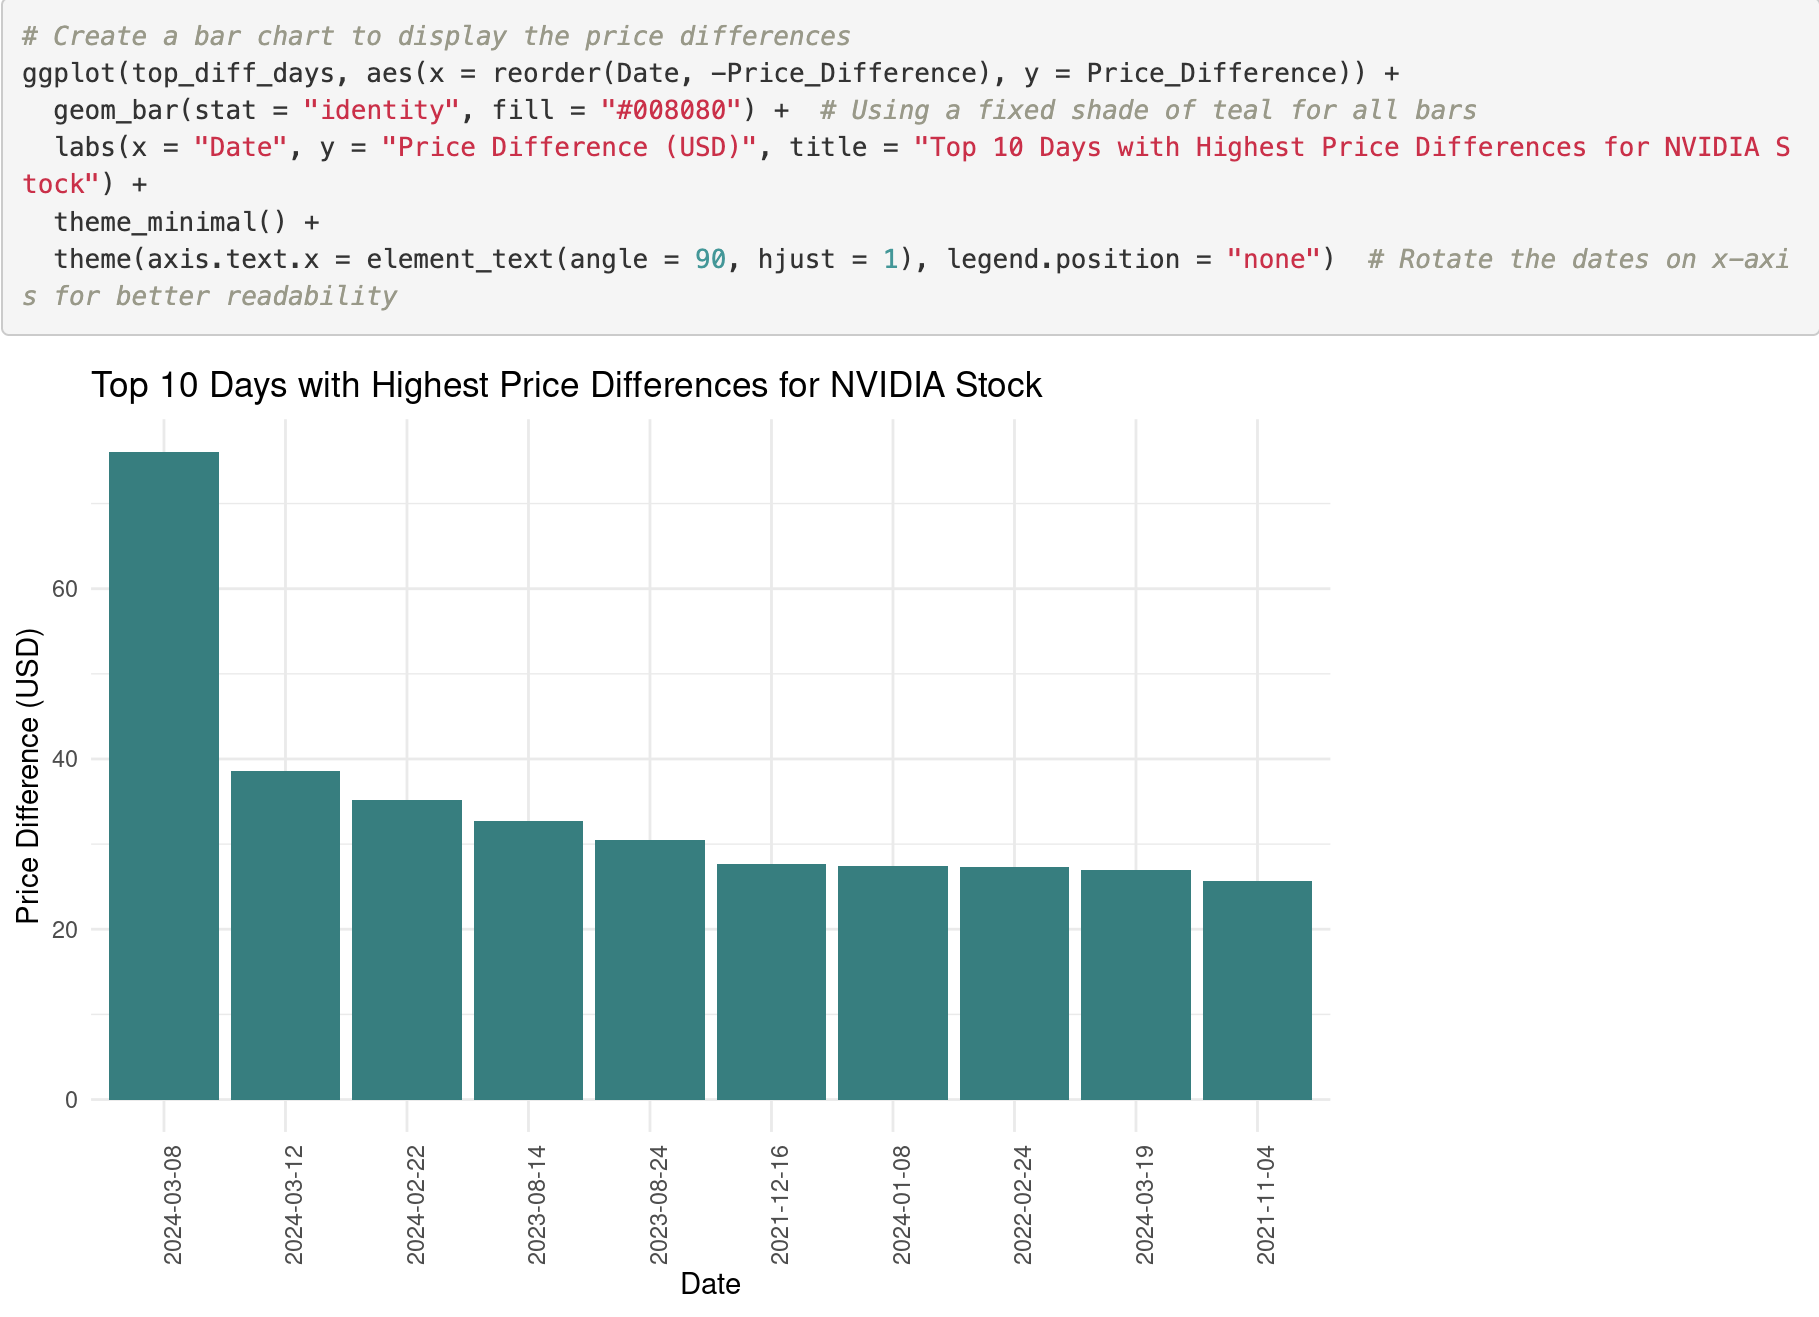
- Top Price Difference Days: Highlights days with the largest difference between open and close prices.
How I built it
- Data Source: Historical NVIDIA stock prices 1999–2024
- Processing: R with tidyverse, dplyr, readr, and ggplot2 for cleaning, merging, and visualization
- Visualization: Line charts, bar charts, and scatter plots to highlight trends and volatility
- Website: GitHub Pages for hosting the interactive HTML report
Sample R Analysis Work
Key Features
- Explore NVIDIA stock trends and volatility
- Analyze daily returns and significant price movements
- Interactive HTML report hosted on GitHub Pages
- Visualizations that clearly explain trends and anomalies
Challenges I ran into
- Data Cleaning: Combining 25 years of stock data without errors
- Volatility Analysis: Identifying periods of high market movement
- Visualization: Making charts readable and informative for a broad audience
Accomplishments that I am proud of
- Created a comprehensive analysis of NVIDIA stock from 1999–2024
- Developed clear visualizations for trends, daily returns, and volatility
- Hosted an interactive HTML report on GitHub Pages
What I learned
- How to analyze long-term financial data and detect patterns
- How to visualize stock trends and volatility using R
- How to combine data analysis with an accessible, interactive web presentation
What is next for NVIDIA Stock Analysis
- Add predictive modeling for future stock trends
- Include interactive dashboards for deeper data exploration
- Incorporate additional financial indicators such as volume and market cap
2025
Flutter, Dart, TMDb API, WebView, URL Launcher, SharedPreferences, Git, GitHub
Python, Flask, BeautifulSoup, Requests, HTML/CSS, Render
Python, Streamlit, Scikit-learn, Random Forest, SVM, FastAPI, Matplotlib, Joblib, Pandas
Back to Top ↑
2024
Python, Salesforce API, NLP, JavaScript, Shell Scripting
Kohl’s × Sephora × PACT Case Study
R, ggplot2, dplyr, tidyverse, readr, HTML, CSS, GitHub Pages
Python, OpenAI API, LangChain, Web Scraping, NLP
Back to Top ↑
2023
HTML, CSS, JavaScript, Python, SpaCy, Matplotlib, Seaborn, GitHub Pages, HuggingFace Spaces, Kaggle
FastAPI, SvelteKit, NLP, SQL, Data Visualization
Back to Top ↑